Published October 28, 2026 · Independent educational guide
Read Chart Axes Before Asking AI to Explain a Business Book Figure
A figure in a business book can make an argument feel clear before you have established what its axes measure. A steep line may reflect a narrow scale, a large bar may reflect a unit multiplier, and a smooth connection may cross a missing value. If you ask AI to explain the figure before recording those details, the resulting paragraph can turn a visual impression into a stronger claim than the chart supports. Read the chart's coordinate system before asking for a conclusion.
This companion guide presents an original reading workflow with six fictional chart cases. It quotes no book, reproduces no published figure and attributes no method to a chapter or author. The small bar comparison and CSV were created for teaching, not extracted from a manuscript, company report or observed model output. Their arithmetic checks establish only the supplied examples. No actual book figure, reader performance, client outcome or professional review is claimed.
Give the figure its own source note
Begin with the edition you are actually reading and the figure's location in that edition. Record its title, caption, axis labels, units, legend and any note that qualifies the data. Keep this source note distinct from your reaction to the image. “The line rises” is an observation about the display; “the method caused growth” is an interpretation requiring more evidence. An AI-generated summary should not erase that difference merely because the surrounding chapter discusses growth.
Statistics Canada's chart guidance identifies titles, axes, legends, notes and sources as components that help readers understand a display. Use that component list as a reading aid, without treating it as a validation of a particular business-book claim. A figure can have a clear title and still leave its population or method unresolved. If the caption cites another report, preserve that reference and distinguish the book's explanation from the underlying source you have or have not examined.
If you work from your own notes rather than an authorized image or excerpt, label the input accordingly. A model reading your transcription is reading that transcription, not independently inspecting the original chart. An omitted unit or footnote can change the result. When a small label is unreadable, record it as unreadable. Do not fill it from the chapter theme or from what seems statistically plausible. The unresolved label is part of the reading task.
Identify what position, length and color represent
Ask which visual feature carries the quantity. A bar commonly uses length from a baseline. A point uses its position against a scale. Color may identify a series, a category or a range according to a legend. Those encodings should remain separate in your explanation. A dark mark is not automatically a larger value, and a high point on one panel is not automatically comparable with a high point on another panel.
Before drafting a summary, write one literal sentence describing the mapping. For example: “In this fictional display, bar height represents an authored count, with categories A and B on the horizontal axis and a numeric vertical scale.” That sentence does not explain why the counts differ. It gives another reader a way to test your interpretation. If your description cannot name the quantity or unit, pause before making a claim about improvement or decline.
Treat decorative perspective, area and position as distinct questions. This guide's teaching chart uses plain two-dimensional bars so the baseline calculation is visible. It does not demonstrate how to reconstruct values from a photographed three-dimensional graphic or an unreadable image. When a figure's geometry makes a value uncertain, report an approximate reading with that limitation instead of presenting a reconstructed number as an exact measurement supplied by the author.
Check the baseline before comparing bar lengths
The Office for National Statistics guidance distinguishes charts whose filled areas or lengths start at an axis from displays such as lines or points. It recommends a zero start for bars and area charts, while discussing circumstances where other chart types can use a cropped axis. That distinction matters when reading a figure: a nonzero start is not a reason to declare every chart deceptive, and an apparent length ratio should not replace the numeric labels.
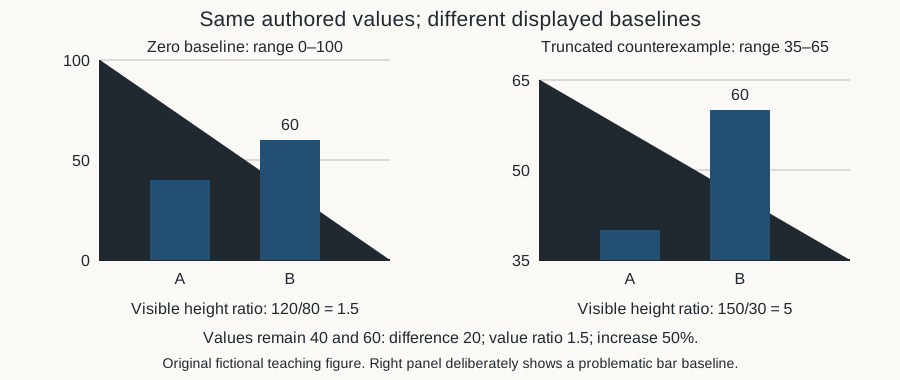
Fictional case A contains two values, forty and sixty. With a zero baseline, the represented lengths are forty and sixty units, so the second is 1.5 times the first. Their numerical difference is twenty and the relative increase from forty is one half, or fifty percent. These relationships come from the authored values, not from a visual estimate. They are unchanged if the drawing is resized while preserving its scale and proportions.
The counterexample panel deliberately starts its displayed range at thirty-five and ends at sixty-five. The visible lengths above thirty-five become five and twenty-five, a ratio of five. That does not make sixty five times forty. The panel is explicitly labeled as a truncated-bar counterexample, not a recommended presentation. Its role is to reveal how an axis start can change visible length ratios while leaving the source values and their difference unchanged.
Describe the original teaching image in words
The supplied image shows case A twice. The left panel uses a zero-to-one-hundred vertical scale and labels the bars A equals forty and B equals sixty. The right panel uses a thirty-five-to-sixty-five scale, labels the same values, and states that it is a deliberately truncated counterexample. The first panel's visible heights are eighty and 120 drawing units; the second's are thirty and 150. Those drawing-unit heights belong to the authored SVG, not to business data.
The text description and case table retain the information needed to understand the example without relying on the image alone. W3C's complex-image tutorial explains the use of a short identifying alternative together with a fuller description of the essential information. This guide applies that idea to its teaching figure; it does not claim a complete accessibility audit or that every chart can be adequately described by the same wording or structure.
When asking AI to help write a description of a real figure, require it to distinguish visible labels from inferred meaning. A short alternative can identify the chart and direct the reader to the explanation. A longer account can preserve the values, scale and qualification relevant to the reading question. Do not let a description introduce a causal conclusion that the picture and its source do not establish. Accessibility text should retain the same evidential limits as the main explanation.
Recognize a multiplicative scale without inventing a growth story
Fictional case B uses positive values two, four and eight on an explicitly authored logarithmic base-two scale. Their logarithms are one, two and three. The plotted positions therefore advance by one equal log step each time. The original values do not increase by equal amounts: the increments are two and four. Their ratios are equal, because each successive value is twice the previous one. Equal visual spacing can thus encode equal multiplication rather than equal addition.
This example is a mathematical construction, not a recommendation to use logarithmic axes for every business figure. The ONS guidance cautions that nonlinear scales can be harder to interpret. A reader who encounters one should retain its labeling and ask what equal distances mean. If the chart does not disclose the scale, do not infer a particular logarithm simply because the line looks straight. The missing definition remains a limitation of the supplied material.
Nor does a straight line on the invented log scale prove that a process will keep doubling. The three values were chosen for teaching and supply no forecast, mechanism or uncertainty estimate. An AI summary can accurately say that the authored values double across the listed positions. It should not say that a company's operating method produced exponential growth, that the pattern generalizes beyond the listed cases, or that a reader should expect the same result.
Read the spacing between dates
Fictional case C lists January 1, January 2 and January 10, 2030, with values ten, twenty and thirty. The value rises by ten between each pair of adjacent observations, but the date gaps are one day and eight days. Dividing each supplied change by its actual interval gives ten units per day for the first segment and 1.25 units per day for the second. These are descriptive calculations on invented endpoints, not measurements of an actual process.
If those dates are drawn as three equally spaced category labels, the visual spacing does not preserve their elapsed-time differences. That may be a feature of the chosen chart structure rather than a hidden error, but your explanation needs to identify it. Do not call the two segments equal rates merely because their drawn rises and horizontal gaps appear equal. Read whether the horizontal axis represents continuous time, ordered categories or another explicitly defined quantity.
Keep observation dates separate from publication dates and the date you copied the figure. A book can display older data, and a later edition can retain an earlier figure. If a chart spans irregular observation intervals, preserve the actual dates when available. A summary that compresses them into “three consecutive days” invents a schedule the source does not supply. The invented dates here exist only to make that kind of mistake easy to inspect.
Compare panels by their labels, not equal-looking positions
Fictional case D has one panel ranging from zero to one hundred with a point at fifty, and a second panel ranging from zero to one thousand with a point at five hundred. Each point lies halfway up its own panel. Their values differ by a factor of ten. Equal relative height across differently scaled panels therefore does not establish equal values. A screenshot that crops the axes would hide the exact information needed to make the comparison.
When reading a group of panels, record each range and unit before comparing visual slopes or heights. Consistent scales can help comparisons, as the ONS guidance notes, but a reader should inspect the actual figure rather than assume consistency. A chart may deliberately use different scales to reveal within-group variation. Your task is to preserve that choice in the explanation and avoid using visual similarity as a substitute for numerical comparison.
Keep series identity attached as well. Two panels might concern different populations, periods or quantities even when their units match. The fictional case assumes a shared illustrative unit solely to isolate the scale issue. It supplies no real-group comparison. If a book places unrelated measures beside each other, a model should not transform their alignment into a claim that one caused or predicted the other. That relationship would require evidence outside the shared page layout.
Retain unit multipliers and denominators
Fictional case E places values two and three under an axis labeled “thousands of illustrative units.” The corresponding quantities are two thousand and three thousand units, with a difference of one thousand. Ignoring the multiplier and reporting a difference of one unit changes the scale by a factor of one thousand. This is an authored unit example, not a real monetary amount, company metric or claim about a book's figures.
Read both the axis and caption for the unit statement. A title may supply information omitted from a compact axis label. If one table shows whole units and another shows thousands, convert explicitly before comparing. Preserve the original displayed values alongside the converted ones so another reader can follow the change. Do not silently rename the column and leave the old numbers in place. That creates a different error even if the resulting chart looks tidy.
A percent axis introduces another question: percent of what? Retain the denominator, population and time period if the source states them. This guide does not calculate a percentage case beyond the explicit relative change in case A, and its examples establish no actual population shares. A model asked to explain an unlabeled percentage should identify the missing base instead of inventing customers, revenue, employees or survey respondents from the surrounding business theme.
Preserve gaps in the supplied series
Fictional case F supplies four intended positions with values ten, twenty, missing and forty. Three positions contain numbers, giving a supplied-value availability fraction of 3/4. The missing position is not zero. The sum of the known values is seventy, but that sum is not the total across all four unknown-or-known positions. The full total remains unresolved unless additional information supplies the missing value or an explicit calculation policy changes the question.
Connecting the point at twenty directly to the point at forty may visually suggest a path through the missing position. The supplied endpoints alone do not establish the intervening value or actual trajectory. An interpolation can be a chosen model or display convention, but it should be labeled as such. Do not let an AI description turn a connecting line into evidence that the series rose steadily through every unobserved position.
Statistics Canada's preparation guidance identifies missing data as a factor affecting chart choice and interpretation. In reading notes, preserve the gap and any source explanation rather than repairing the series for narrative flow. The availability fraction in case F describes only the four authored positions. It is not a measure of semantic coverage, representative sampling or the completeness of a book's research. Keep the denominator narrow enough that the number says only what was actually counted.
Separate a chart description from the author's argument
After recording the chart's structure, write two different sentences. The first should describe what the supplied figure shows under its labels. The second can state the author's interpretation if you have actually read the relevant passage, with an appropriate locator. Do not merge the two merely because the figure appears beside the argument. A display can support a descriptive comparison while leaving causation, generalization or a practical recommendation unsettled.
You can also disagree with an argument while describing its figure faithfully. Record the specific question: an unclear population, a missing comparison, a changing denominator or a unit that does not match the surrounding text. Avoid diagnosing deception from an axis choice alone. The teaching counterexample demonstrates a geometry problem; it does not accuse a real author or publisher of using that design. A careful reading note identifies the evidence it has and the conclusion it cannot yet support.
For a reading group, give participants the same figure locator and ask each to write a literal description before discussing its implications. Compare which labels they retained and which assumptions they added. An AI tool can help organize those differences, but it should not impersonate the author or declare a participant professionally competent. The useful outcome is a clearer shared account of the source and the remaining questions, not a manufactured score of reading ability.
Use a bounded AI prompt and check its result
An original teaching prompt is: “Using only my supplied transcription and description, identify the chart type, axis ranges, units, scale type, time spacing, legend and missing values. Separate what is supplied from what is unresolved. Describe numerical comparisons only when the inputs support them. Do not invent book quotations, figure details, research methods, causal explanations or business results.” This prompt narrows the task; it is not a tested guarantee of model behavior.
Inspect the response for predictable changes of meaning. Did it turn the truncated bar's five-to-one visible-height ratio into a fivefold data-value claim? Did it call equally spaced log positions equal additive growth? Did it treat January 1, 2 and 10 as consecutive days? Did it omit “thousands,” fill the gap with zero, or read equal panel height as equal values? The six fictional cases give you concrete questions to ask when reviewing the explanation.
If the input is only a partial screenshot, ask for a partial description with unresolved labels retained. Do not reward the most complete-sounding answer when the image itself is incomplete. When an answer requires a caption, table or original data source you have not inspected, name that prerequisite. A model can draft a useful follow-up question, but it cannot supply evidence simply by writing a plausible caption in the style of a business book.
Connect the reading task to the right companion resource
Use the glossary resource when the difficulty is the meaning of a term or unit label. Use the argument-mapping resource when the question is how a claim, evidence and qualification connect. Use the Elixir table-meaning guide when a chart description is being transferred into structured fields, and the histogram guide when bin edges and count-versus-density distinctions are the actual issue. These resources address related questions without replacing the figure's own source or claiming an author-endorsed method.
End your note with the next concrete reading action. You might need to locate the caption, confirm an edition, transcribe a unit multiplier or inspect a cited data table. If the chart's labels and arithmetic are already clear, the next question may concern the argument rather than the picture. Keeping those stages visible lets AI help with explanation while the reader remains responsible for deciding what the material actually supports.
Frequently asked questions
Does a nonzero axis mean a chart is automatically misleading?
No. The visual encoding matters. ONS guidance distinguishes bars or filled areas from lines and points when discussing axis starts. Read the actual scale and chart type before interpreting the design. Case A deliberately truncates bars to demonstrate a visible-length ratio that differs from the value ratio; it is a teaching counterexample, not an accusation about a real figure.
Can AI infer an unreadable unit from the chapter's subject?
It can suggest possibilities, but a possibility is not a verified label. Record the unit as unreadable and return to the figure, caption or relevant source. Case E shows why a missing “thousands” multiplier can change the scale by one thousand. A business theme does not establish whether an axis measures units, thousands, percentages or another quantity.
Do equally spaced points always represent equal changes?
No. Equal positions on the authored base-two log scale in case B correspond to equal multiplicative steps, while the original values increase by two and four. Equal spacing of date categories can also conceal unequal elapsed intervals, as case C demonstrates. Preserve the scale type and date spacing before describing the rate or size of change.
Can I compare heights across two panels without reading both axes?
Not reliably. Case D places fifty on a zero-to-one-hundred panel and five hundred on a zero-to-one-thousand panel; both appear halfway up while their values differ tenfold. Units, populations and periods may also differ in a real figure. Inspect the labels and the intended comparison rather than treating visual alignment as proof of equal quantities.
Should a missing plotted value be replaced with zero?
Not unless the source or an explicit chosen calculation policy supplies a justified reason, and that transformation is disclosed. A missing value is different from an observed zero. Case F retains the gap and reports only three known values out of four supplied positions. It does not establish the unknown value, a complete total or a steady path through the gap.
Does this guide reproduce or validate a figure from one of the books?
No. Its six cases and bar comparison are original fictional teaching material. They contain no book quotation, manuscript extraction, chapter-method attribution, observed model response or actual business data. The checks verify supplied arithmetic and image dimensions only. They establish no author endorsement, professional review, measured learning improvement or operating recommendation.
Original fictional practice data
Original fictional teaching cases, not actual client records, reservations, model outputs, professional review or operating approval. No executable utility is supplied.
| fictional case | authored inputs | bounded result |
|---|---|---|
| A | authored values40/60;full baseline0;truncated baseline35;SVG full heights80/120 versus cut heights30/150 | actualratio3/2/difference20/relativeincrease1/2;cut visible ratio5 NOT fivefold data values |
| B | authored positive values2/4/8 on declared log base2 | logpositions1/2/3/equalsteps1;additiveincrements2/4 versusmultipliers2/2 NOTactualgrowth/forecast |
| C | 2030-01-01value10;2030-01-02value20;2030-01-10value30 | gaps1/8days;endpointchanges10/10;segmentrates10 and5/4 units/day NOTactualprocess/causaltrend |
| D | panelA range0-100point50;panelB range0-1000point500 | bothrelativeheight1/2;value ratio10 NOTequal quantities or real groups |
| E | axis labelthousands of illustrative units;values2/3 | 2000/3000units;difference1000 versusliteral1;factor1000 NOTactualmoney/bookfigure |
| F | four intended positions;values10/20/missing/40 | 3knownof4/availability3/4/knownsum70;fulltotalunknown;missingNOTzero/interpolatedpath |
Primary sources and editorial scope
- ONS primary chart-design guidance: baseline, scale and comparable-panel context only; not validation of a book figure
- Statistics Canada primary component/source/missing-data context; no published figures reproduced
- W3C short and extended complex-image descriptions; no complete accessibility certification
AI-assisted website editorial. Sources read October 28, 2026 America/New_York. Original fictional chart-reading examples only; no actual book figure, quotation, manuscript, chapter method, model output or client result. No author endorsement or complete accessibility assessment. Original examples checked independently. No record change, actual client dataset, observed model output, professional review, security certification or operating approval is asserted.
Related practical questions